AURORA
An independent index of Canadian federal UAP records, with case files, source links, and a map.
GitHub repositoryData & maps / Data visualization
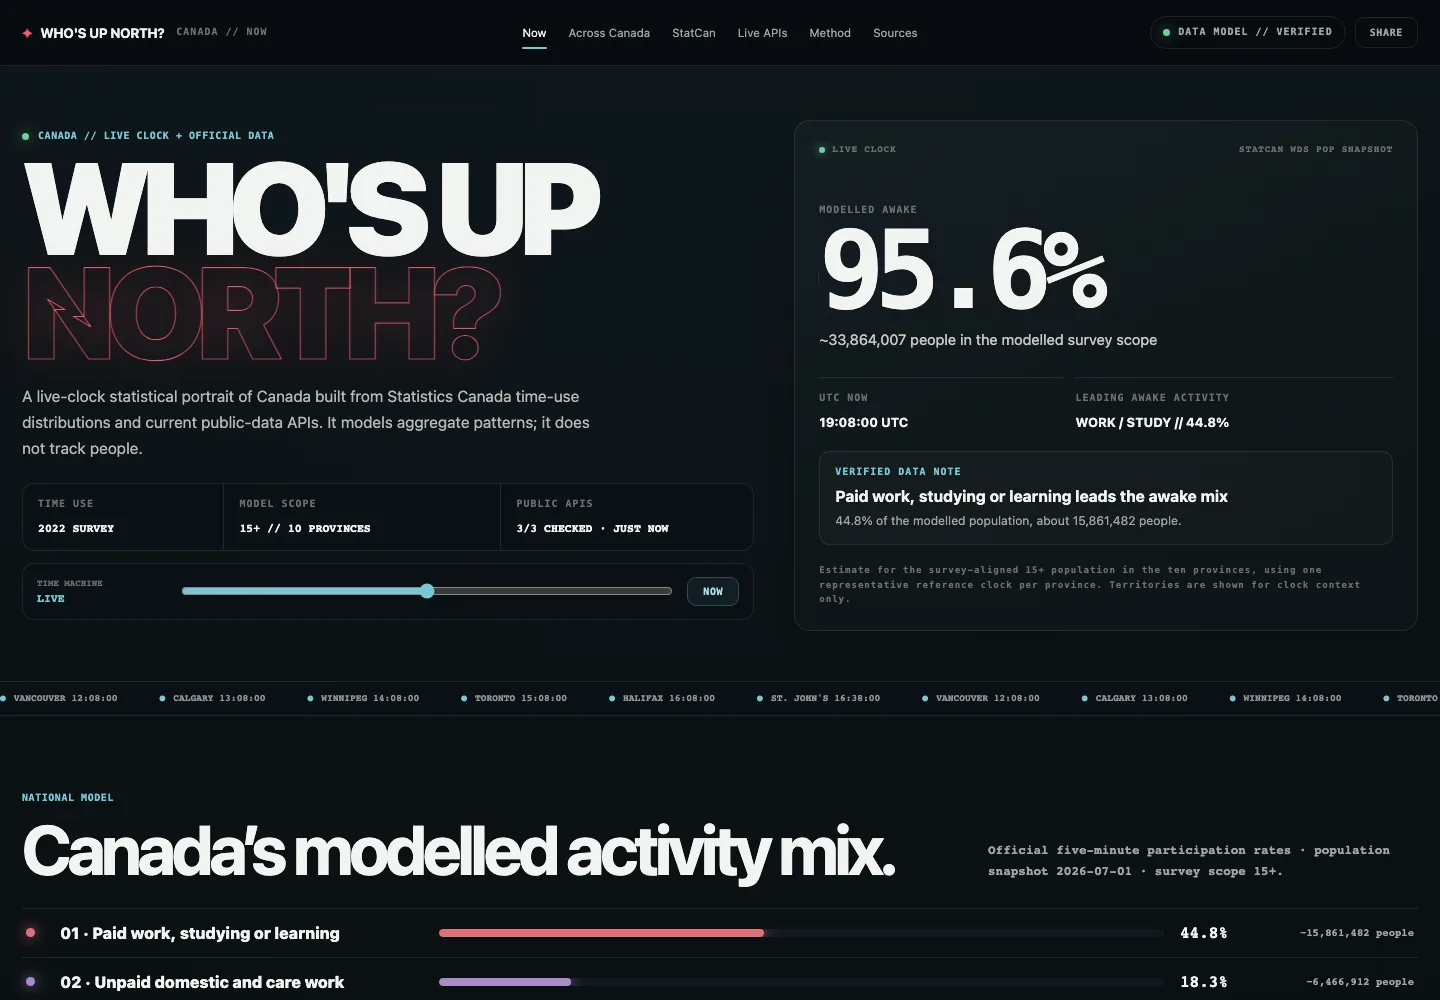
A statistical portrait of Canada: local clocks, time-use distributions, and source-labeled public data brought into one visual experience.
NosytLabs/who-up-northPublic repository
Overview
A statistical portrait of Canada using official survey profiles, population estimates, and local clocks. Modelled activity, not live tracking of people.
Activity is modeled from official data. It is not live tracking of individual people.
Published site · 2026-10-23
Getting started
The time-use model covers the ten provinces. Territories appear as clock and data context, and are excluded from that activity estimate. The site does not track individuals.
Read the data modelBased on the public README, reviewed 23 October 2026. Check the repository for updates.
Keep exploring
Client work
Allow Google Analytics to measure page visits and successful inquiries. Your form text and email address are not included. Privacy details